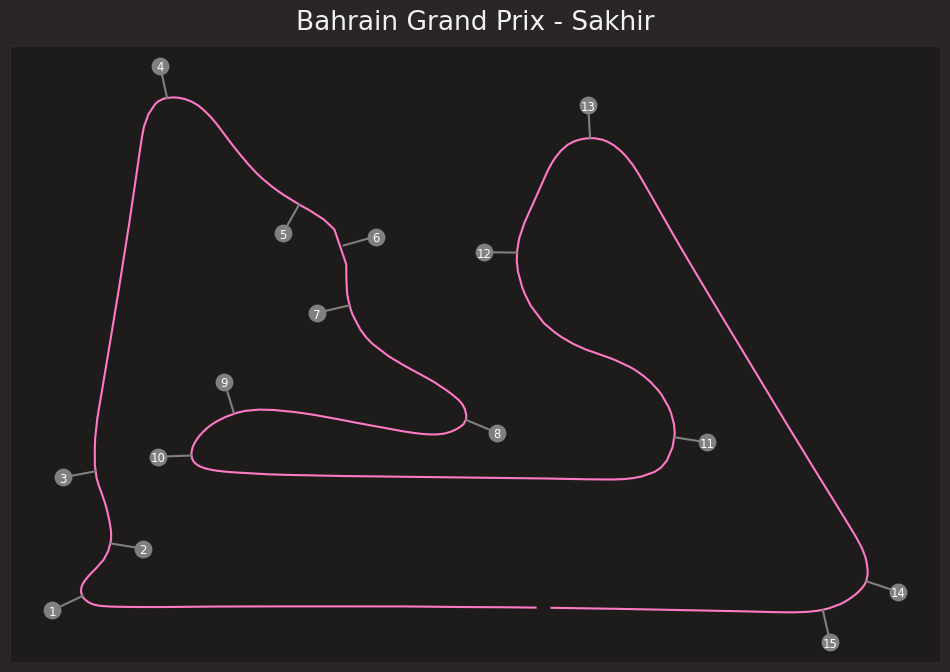
Résumé du grand prix de Bahrain 2024
import fastf1 as ff1
import fastf1.plotting
from matplotlib import pyplot as plt
import numpy as np
fastf1.plotting.setup_mpl()
session = ff1.get_session(2024, 'Bahrain', 'Race')
session.load()

plt.figure(figsize=(12, 8))

lap = session.laps.pick_fastest()
pos = lap.get_pos_data()

circuit_info = session.get_circuit_info()

def rotate(xy, *, angle):
    rot_mat = np.array([[np.cos(angle), np.sin(angle)],
                        [-np.sin(angle), np.cos(angle)]])
    return np.matmul(xy, rot_mat)

track = pos.loc[:, ('X', 'Y')].to_numpy()

track_angle = circuit_info.rotation / 180 * np.pi

rotated_track = rotate(track, angle=track_angle)
plt.plot(rotated_track[:, 0], rotated_track[:, 1])


offset_vector = [500, 0]

for _, corner in circuit_info.corners.iterrows():
    txt = f"{corner['Number']}{corner['Letter']}"

    offset_angle = corner['Angle'] / 180 * np.pi

    offset_x, offset_y = rotate(offset_vector, angle=offset_angle)

    text_x = corner['X'] + offset_x
    text_y = corner['Y'] + offset_y

    text_x, text_y = rotate([text_x, text_y], angle=track_angle)

    track_x, track_y = rotate([corner['X'], corner['Y']], angle=track_angle)

    plt.scatter(text_x, text_y, color='grey', s=140)

    plt.plot([track_x, text_x], [track_y, text_y], color='grey')

    plt.text(text_x, text_y, txt, va='center_baseline', ha='center', size='small', color='white')

plt.title(session.event['EventName'] + ' - ' + session.event['Location'])
plt.xticks([])
plt.yticks([])
plt.axis('equal')
plt.savefig('bahrain_2024_circuit.png', bbox_inches='tight')
plt.show()

fig, ax = plt.subplots(figsize=(12, 8), dpi=300)
driver_positions = {}
driver_old_positions = {}
for drv in session.drivers:
drv_laps = session.laps.pick_driver(drv)
abb = drv_laps['Driver'].iloc[0]
last_position = drv_laps['Position'].iloc[-1]
initial_position = drv_laps['Position'].iloc[0]
driver_positions[last_position] = abb
driver_old_positions[initial_position] = abb
sorted_old_positions = sorted(driver_old_positions.keys())
yticks_labels_old = [f"P{int(pos)}: {driver_old_positions[pos]}" for pos in sorted_old_positions]
sorted_positions = sorted(driver_positions.keys())
yticks_labels = []
for pos in sorted_positions:
abb = driver_positions[pos]
initial_pos = next(key for key, value in driver_old_positions.items() if value == abb)
change = int(initial_pos - pos)
change_str = f"+{abs(change)}" if change >= 0 else f"-{abs(change)}"
yticks_labels.append(f"P{int(pos)}: {abb} ({change_str})")
for drv in session.drivers:
drv_laps = session.laps.pick_driver(drv)
abb = drv_laps['Driver'].iloc[0]
color = ff1.plotting.driver_color(abb)
ax.plot(drv_laps['LapNumber'], drv_laps['Position'], label=abb, color=color, marker='o')
ax.set_ylim([20.5, 0.5])
ax.set_yticks(sorted_old_positions)
ax.set_yticklabels(yticks_labels_old)
ax.set_xlabel('Lap Number')
ax.set_ylabel('Initial Track Position')
ax_right = ax.twinx()
ax_right.set_ylim([20.5, 0.5])
ax_right.set_yticks(sorted_positions)
ax_right.set_yticklabels(yticks_labels)
ax.legend(bbox_to_anchor=(1.25, 1))
plt.grid()
plt.title("Formula 1 - Bahrain Grand Prix 2024")
plt.savefig('bahrain_2024_positions.png', bbox_inches='tight')
plt.tight_layout()
plt.show()

driver_emphasis = ['OCO', 'GAS']
fig, ax = plt.subplots(figsize=(12, 8), dpi=300)
driver_positions = {}
driver_old_positions = {}
for drv in session.drivers:
drv_laps = session.laps.pick_driver(drv)
abb = drv_laps['Driver'].iloc[0]
last_position = drv_laps['Position'].iloc[-1]
initial_position = drv_laps['Position'].iloc[0]
driver_positions[last_position] = abb
driver_old_positions[initial_position] = abb
sorted_old_positions = sorted(driver_old_positions.keys())
yticks_labels_old = [f"P{int(pos)}: {driver_old_positions[pos]}" for pos in sorted_old_positions]
sorted_positions = sorted(driver_positions.keys())
yticks_labels = []
for pos in sorted_positions:
abb = driver_positions[pos]
initial_pos = next(key for key, value in driver_old_positions.items() if value == abb)
change = int(initial_pos - pos)
change_str = f"+{abs(change)}" if change >= 0 else f"-{abs(change)}"
yticks_labels.append(f"P{int(pos)}: {abb} ({change_str})")
for drv in session.drivers:
drv_laps = session.laps.pick_driver(drv)
abb = drv_laps['Driver'].iloc[0]
color = ff1.plotting.driver_color(abb)
if abb in driver_emphasis:
ax.plot(drv_laps['LapNumber'], drv_laps['Position'], label=abb, color=color, marker='o', markersize=10, linewidth=2.5)
else:
ax.plot(drv_laps['LapNumber'], drv_laps['Position'], label=abb, color=color, alpha=0.2, marker='o')
ax.set_ylim([20.5, 0.5])
ax.set_yticks(sorted_old_positions)
ax.set_yticklabels(yticks_labels_old)
ax.set_xlabel('Lap Number')
ax.set_ylabel('Initial Track Position')
ax_right = ax.twinx()
ax_right.set_ylim([20.5, 0.5])
ax_right.set_yticks(sorted_positions)
ax_right.set_yticklabels(yticks_labels)
ax.legend(bbox_to_anchor=(1.25, 1))
plt.grid()
plt.title("Formula 1 - Bahrain Grand Prix 2024")
plt.savefig('bahrain_2024_positions_OCO_GAS.png', bbox_inches='tight')
plt.tight_layout()
plt.show()

laps = session.laps
drivers = session.drivers
drivers = [session.get_driver(driver)["Abbreviation"] for driver in drivers]
stints = laps[["Driver", "Stint", "Compound", "LapNumber"]]
stints = stints.groupby(["Driver", "Stint", "Compound"]).count().reset_index()
stints = stints.rename(columns={"LapNumber": "StintLength"})
fig, ax = plt.subplots(figsize=(12, 8), dpi=300)
for driver in drivers:
driver_stints = stints.loc[stints["Driver"] == driver]
previous_stint_end = 0
for idx, row in driver_stints.iterrows():
plt.barh(
y=driver,
width=row["StintLength"],
left=previous_stint_end,
color=ff1.plotting.COMPOUND_COLORS[row["Compound"]],
edgecolor="black",
fill=True
)
t = plt.text(
x=previous_stint_end + row["StintLength"]/2,
y=driver,
s=row['StintLength'],
va='center',
ha='center',
color='white',
fontsize=6,
)
t.set_bbox(dict(facecolor='black', alpha=0.8, edgecolor='black'))
previous_stint_end += row["StintLength"]
compound_colors = ff1.plotting.COMPOUND_COLORS
handles = [plt.Rectangle((0,0),1,1, color=compound_colors[comp]) for comp in compound_colors]
labels = [comp for comp in compound_colors]
ax.set_axisbelow(True)
ax.legend(handles, labels, title="Types des pneus", bbox_to_anchor=(1, 1.01), loc='upper left')
plt.xlabel('Tour')
plt.ylabel('Pilotes')
plt.grid(alpha=0.5, color='gray')
plt.title("Formula 1 - Bahrain Grand Prix 2024")
plt.savefig('bahrain_2024_pneus.png', bbox_inches='tight')
plt.show()

def time_to_seconds(time_str):
days_part, time_part = time_str.split(' days ')
days = int(days_part)
hours, minutes, seconds = map(float, time_part.split(':'))
total_seconds = days * 86400 + hours * 3600 + minutes * 60 + seconds
return total_seconds
fig, ax = plt.subplots(figsize=(12, 8), dpi=300)
for drv in session.drivers:
drv_laps = session.laps.pick_driver(drv)
if drv_laps.empty:
print(f"No laps found for driver {drv}")
continue
abb = drv_laps['Driver'].iloc[0]
color = ff1.plotting.driver_color(abb)
lap_number = drv_laps['LapNumber']
lap_time_seconds = drv_laps['LapTime'].apply(lambda x: x.total_seconds())
ax.plot(lap_number, lap_time_seconds, label=abb, color=color, marker='o')
ax.set_axisbelow(True)
ax.legend(bbox_to_anchor=(1.1, 1.01))
plt.xlabel('Tour')
plt.ylabel('Temps au tour (s)')
plt.title("Formula 1 - Bahrain Grand Prix 2024")
plt.savefig('bahrain_2024_temps_au_tour.png', bbox_inches='tight')
plt.show()

driver_emphasis = ['OCO', 'GAS']
def time_to_seconds(time_str):
days_part, time_part = time_str.split(' days ')
days = int(days_part)
hours, minutes, seconds = map(float, time_part.split(':'))
total_seconds = days * 86400 + hours * 3600 + minutes * 60 + seconds
return total_seconds
fig, ax = plt.subplots(figsize=(12, 8), dpi=300)
for drv in session.drivers:
drv_laps = session.laps.pick_driver(drv)
if drv_laps.empty:
print(f"No laps found for driver {drv}")
continue
abb = drv_laps['Driver'].iloc[0]
color = ff1.plotting.driver_color(abb)
lap_number = drv_laps['LapNumber']
lap_time_seconds = drv_laps['LapTime'].apply(lambda x: x.total_seconds())
if abb in driver_emphasis:
ax.plot(lap_number, lap_time_seconds, label=abb, color=color, marker='o', linewidth=3, markersize=8, zorder=5)
else:
ax.plot(lap_number, lap_time_seconds, label=abb, color=color, marker='o', alpha=0.2, linewidth=1, markersize=4)
ax.set_axisbelow(True)
ax.legend(bbox_to_anchor=(1.1, 1.01))
plt.xlabel('Tour')
plt.ylabel('Temps au tour (s)')
plt.title("Formula 1 - Bahrain Grand Prix 2024")
plt.savefig('bahrain_2024_temps_au_tour_OCO_GAS.png', bbox_inches='tight')
plt.show()

fig, ax = plt.subplots(figsize=(12, 8), dpi=300)

delta_positions = []
driver_abbreviations = []

for drv in session.drivers:
    drv_laps = session.laps.pick_driver(drv)
    position = drv_laps['Position'].iloc[0]
    new_position = drv_laps['Position'].iloc[1]
    delta_position = position - new_position

    abb = drv_laps['Driver'].iloc[0]
    color = ff1.plotting.driver_color(abb)

    delta_position
    abb

    ax.barh(abb, delta_position, color=color, edgecolor='black', alpha=0.7)

    t = plt.text(
        x=delta_position,
        y=abb,
        s=f'P{int(new_position)}',
        va='center',
        ha='center',
        color='white',
        fontsize=9,
    )

    t.set_bbox(dict(facecolor='black', alpha=0.9, edgecolor='black'))

ax.xaxis.set_major_locator(plt.MaxNLocator(integer=True))

for i, (delta_position, abb) in enumerate(zip(delta_positions, driver_abbreviations)):
    ax.text(delta_position, i, f'{delta_position:+}', ha='center', va='center', fontsize=9, color='white')

ax.set_axisbelow(True)
plt.xlabel('Position gagnée/perdue')
plt.ylabel('Drivers')
plt.title("Formula 1 - Bahrain Grand Prix 2024")
plt.savefig('bahrain_2024_position_start.png', bbox_inches='tight')
plt.grid(True, linestyle='--', linewidth=0.5)
plt.show()


